Maximise your business efficiency with OptimiseNow Consultancy!
Boost Productivity with OptimiseNow Consultancy | Workflow Optimisation Experts
At OptimiseNow Consultancy, we specialise in workflow analysis and process optimization to increase efficiency and productivity. Our proven strategies identify bottlenecks and uncover opportunities for improvement, ensuring seamless operations and streamlined business processes.
Enhance your business performance today! Contact OptimiseNow Consultancy for expert workflow optimization solutions that drive growth and efficiency.
Let's make work simple!
We specialize in analysing existing workflows to identify opportunities for improvement and boost efficiency. Our proven strategies ensure your operations run seamlessly, enhancing productivity and streamlining processes for maximum performance. Contact us today to discover how we can optimise your business workflows!
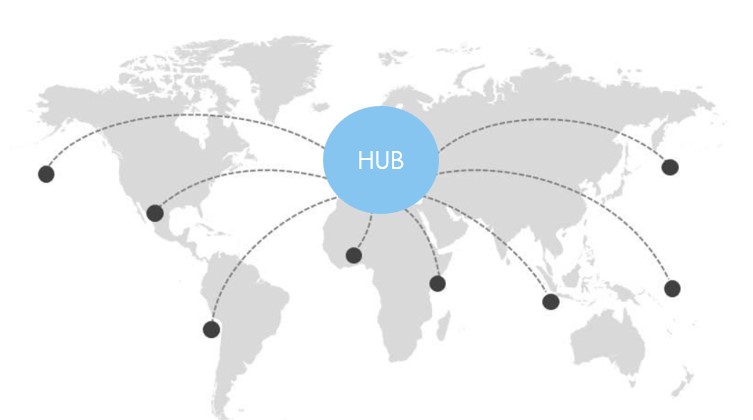
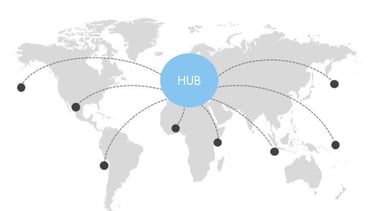


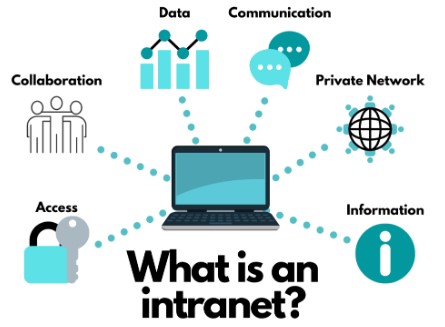
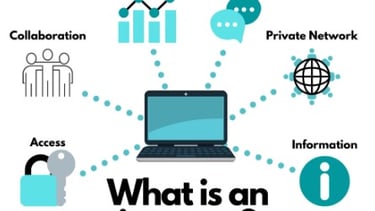
An intranet system provides a secure and centralised platform for employees to access essential resources, tools, and information, enhancing collaboration and communication within an organisation. By offering a single source for company documents, policies, and announcements, an intranet reduces the time employees spend searching for information, increasing productivity. Employees can quickly find contacts, departmental resources, and recent updates, streamlining workflows and improving information sharing across teams. The intranet also serves as a hub for internal communications, enabling team members to share knowledge, post updates, and collaborate on projects, regardless of their physical location.
business process outsourcing (bpo) and optimisation involve outsourcing key business functions to specialised service providers, allowing companies to focus on core operations. by outsourcing tasks like customer service, payroll, data entry, and it support, businesses can reduce costs, boost efficiency, and access advanced technologies and skilled talent. bpo is widely used across industries to improve scalability, streamline operations, and maintain a competitive edge in the market.


IMPLEMENT EFFECTIVE CHANGE MANAGEMENT STRATEGIES TO ENSURE A SMOOTH TRANSITION DURING ORGANISATIONAL TRANSFORMATIONS, REDUCING DISRUPTION AND MAXIMISING EMPLOYEE ADOPTION.
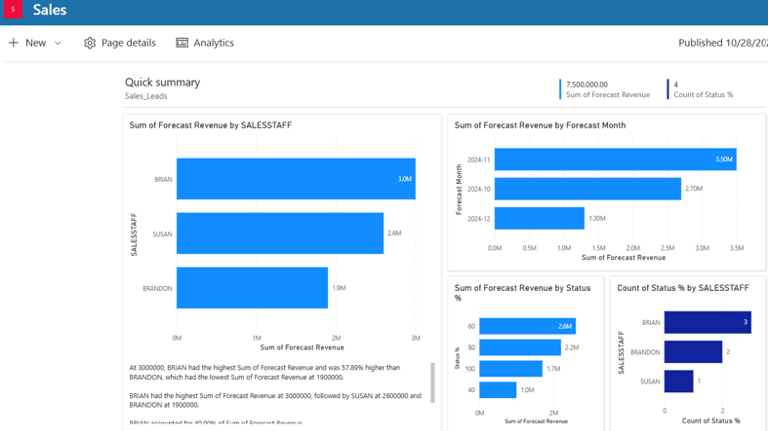


COMMERCIAL LEADS MANAGEMENT SYSTEM (CLMS) IS A SYSTEM TO CAPTURE, ORGANISE, AND TRACK POTENTIAL BUSINESS OPPORTUNITIES. EFFECTIVE LEADS MANAGEMENT ENHANCES CONVERSION RATES BY LEVERAGING DATA ANALYTICS AND CRM TOOLS FOR TIMELY FOLLOW-UPS AND PRIORITISATION VALUABLE LEADS. THIS PROCESS STREAMLINES SALES EFFORTS, BOOSTS CUSTOMER ENGAGEMENT AND MAXIMISES REVENUE POTENTIAL. OUR CLOUD-BASED CLMS IS SECURE, HIGHLY CONFIGURABLE AND ADAPTABLE TO MEET YOUR UNIQUE BUSINESS NEEDS.
DIGITISED EXPENSE CLAIMS SYSTEM (DECS) STREAMLINES THE PROCESS OF SUBMITTING, TRACKING AND REIMBURSING EXPENSES BY REPLACING MANUAL PAPER-BASED METHODS WITH A DIGITAL PLATFORM.
OPTIMISENOW CONSULTANCY IS PROUD TO ANNOUNCE WE ARE NOW AN AUTHORISED MICROSOFT RESELLER! CONTACT US FOR MORE DISCOUNTS ON MICROSOFT PRODUCTS!

“OptimiseNow Consultancy completely transformed our operations. Their insights were invaluable, and we saw immediate improvements in efficiency.”
Leonard Lee (Prime Shipping Services)
“The team at OptimiseNow truly understands our needs. They worked closely with us to ensure we achieved our goals.”
Leonard Liew (Majubina Resources Sdh Bhd)
★★★★★
★★★★★
Contact Us


Reach out today to explore how we can enhance your workflows and boost your business efficiency.
Efficiency
Boost your operations and enhance productivity today.
Contact
Optimise NoW!
Brandon Lee - Executive Director
Mobile:+6017 222 1888
Email : brandon@optimisenow.onmicrosoft.com
Brian Leow - Commercial Director
Mobile: +6012 393 0940
Email : brian@optimisenow.onmicrosoft.com
© 2025. All rights reserved.